 If knowledge is power then data are the individual watts; one by itself is aesthetically pleasing,
but functionally useless. It’s only when we add all the watts together that we produce enough
power to move forward. Constitutionally we own this power, but the trickle of information
provided to the public is practically useless – and so the Open data and Democracy Initiative was born: Not to fight against government and the private sector, but to aid them in data
liberation; something that has helped empower citizens in other African countries.

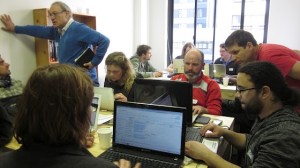
We came together as a group of concerned technologists, civil society activists, journalists, data
analysts and computer programmers; to find a way to open more important data to the public
(like SDAs), and also to show what can be done with this open data, because from anecdotal
evidence we found that the power of Open Data is lost on the man in the street. By holding
a Hackathon and creating software applications that facilitate social change, we could free
ourselves from a common South African problem of talking about solutions without acting, and instead create something tangible and therefore more meaningful.
The results of the hackathon far exceeded my expectations and vindicated our faith in the idea
of getting people with problems together with people who can solve them using technology.
So what exactly do we have to show for our good intentions? Looking at 3 of the apps that were
created you can judge for yourself.
![]()
Based on the data of over 85,000 non-profits in South Africa, a mapping application was created
allowing users to visit a website with a map of South Africa on which all 85 000 registered NGOs
were pinpointed in their geographical location. The app lets users find specific NGOs (they can
also be filtered into categories), as well as provide contact information for each, making it easy
to quickly find the right organisation according to your need and location.
The real power in mapping datasets, however, lies in cross referencing two or more. If we can
combine this map of NGOs with a map of health problems we start to see correlations of data.
You could for example find that an area with a high HIV level may have a low number of health
NGOs, all because two datasets were married. This same technology framework can be used
for hospitals and disease, schools and pass rates etc.
##SchoolReport

SchoolReport is an app designed to give learners a public platform to report serious issues
happening at their school; giving a voice to the voiceless in a crisis ridden education system.
The project started with basic data on schools in the Western Cape, including location, student
and teacher numbers, and matriculation results. Departing from their original goal of merely
reporting the available data on each individual school, the group incorporated a commenting
system where learners can report problems within their school with the view of using this
public channel to force positive change in their school. These problems were broken down
into different categories (and colour coded for better navigation), namely: buildings, textbooks,
corruption, bullying and crime.
SchoolReport is currently in discussions with Equal Education to create a resolution path for
the complaints, so that action is taken, instead of just a whole bunch of digital moaning. If
successful, SchoolReport could be incorporated into existing social media platforms like Mxit
and Facebook, making it easy to report mismanagement of schools and bring about change in
areas where it is sorely needed.
##ProtestMap
ProtestMap is an app designed to show, graphically, the places where service delivery protests
have happened. It was conceived through trying to understand the root causes of a spate of
service delivery protests in South Africa, and unsurprisingly a brief search yielded no datasets.
Without knowing where it would lead, they created their own geocoded dataset from online
news reports, then overlaid this with data from the previous census to try give these protests
some kind of context.
The obvious problem is that they needed to collect all the data themselves. With an open
database created on a data hub, there is an opportunity for journalists (and whoever else can
accumulate statistics on protests) can slowly build a more rigorous dataset of protests around
service delivery.
The group aims to continue with the project and provide an open resource for researchers,
journalists and policy makers to engage this data and better understand the general trends that
fuel protests.
It is difficult to understand the outcomes of our inaugural Hackathon without experiencing the
actual apps. But what is clear is that there is a group of people in Cape Town (and the rest of
South Africa) who have the skills to help large sectors of marginalised South Africa, and more
importantly are willing.
The Open Data and Democracy Initiative is still in its infancy and we are holding an open
strategy planning meeting this Friday:
ODADI Strategy Planning open meeting
Friday 17th August, 14:00-18:00
Buchanan Square, 160 Sir Lowry (Main) Rd
Woodstock, Cape Town
(secured parking available)


1 thought on “The very first Open Data and Democracy Initiative Hackathon, South Africa”
Comments are closed.