Are the World Bank and Department for International Development (DfID) spending money on projects in similar sectors and countries? Does all aid to Kenya go the North-East? How much aid in total did India receive last year?
Until recently, it was impossible to know. But now, thanks to the International Aid Transparency Initiative (IATI), we’ve been able to start to answer these questions – making the aid process more transparent, which is crucial for making it more effective.
IATI is a political agreement by the world’s major donors – including international banks, private foundations and NGOs – on a common way to publish aid information. It also defines a technical standard for exactly how that information should be published, IATI-XML.
So far, 29 donors representing 74% of Official Development Finance (ODF) have committed to publishing to IATI. A further 13 donors representing 45% of ODF have already published, and 12 NGOs and foundations have published their own data.
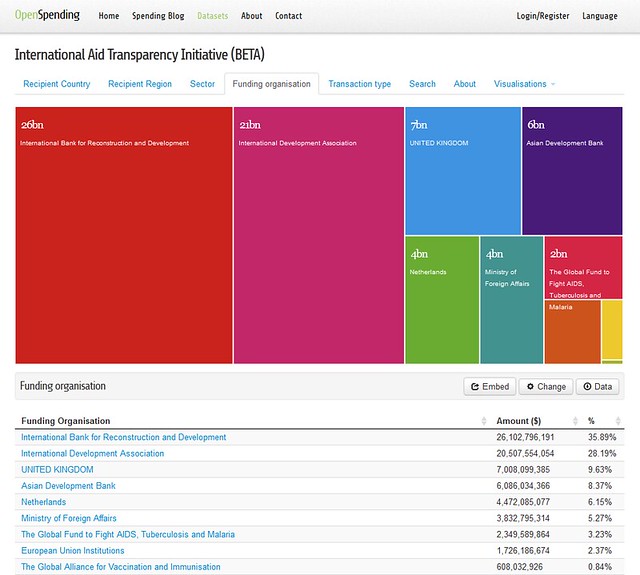
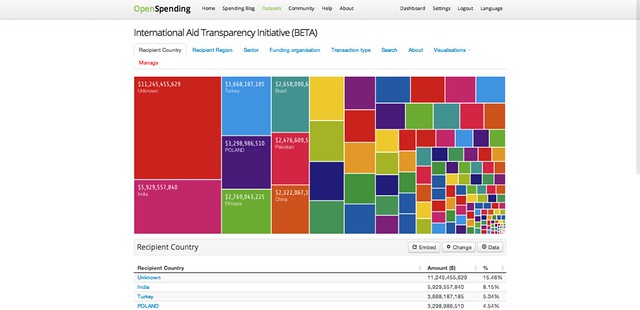
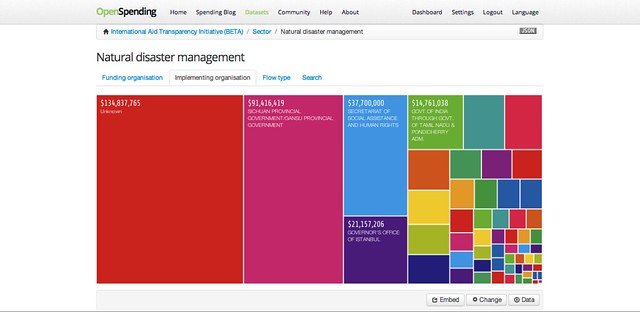
This post details how we converted each donor’s data, using simple scripts and open source tools, from raw XML data in the IATI Registry into a consolidated dataset and then, via loading into OpenSpending to visualisations like those shown above and an easy-to-use RESTful API.


Getting the Data Together
Full details of how we got the data together are in this case study on OpenSpending … but to summarize:
- We grabbed a list of all the IATI data files via the IATI Registry API (the IATI registry is running CKAN so this is very easy)
- We converted the data to an SQLite database and a simplified CSV format and posted these on the IATI dataset on the DataHub
- Modelled and loaded it into OpenSpending, creating views to visualize it in basic forms.
What you can see
You can now explore the complete dataset of aid data released so far through IATI, exploring the aggregate and detailed data on OpenSpending. You can drill down through the data and look at it from different perspectives, from exploring the largest sectors in a country, to different implementing organisations in that sector, to looking at all the projects implemented by a single organisation.
Drill down from one layer…

… to the next – we’re zooming in on China here, breaking down by flow type…

… and you can switch between breakdowns – slicing data here up by organisations implementing the aid…

… and here by funding organisation

More details
We’ve also just put together a briefing on how we worked with the IATI data on OpenSpending.org. The briefing covers in depth what IATI is, using the IATI registry, consolidating data into a simple format, loading data into OpenSpending and using the API.
Next steps & get involved.
For those keen to put coding knowledge to good use to further the IATI mission, some ideas below:
- Use the API – you can use OpenSpending’s API to build applications – read the briefing for more ideas and instructions
- Review our scripts for converting IATI data. We’ve been compiling a list of known issues with possible future extensions such as geo-coding, reconciling organisations and handling currencies.
What’s in the data, what’s still to come
The dataset contains current and future spending by major aid donors representing 44% of ODF, with disbursement data running up to the current month in some cases. It also contains commitment data up to 2016 from one donor (and from multiple donors up to 2014).
However, the data does not contain any information from donors who have not yet published to IATI, and it also does not yet include results, project documents or geo-coded data.
Future projects might include:
- Validation – to ensure that data is properly formatted and uses standard codelists;
- Adding results, geo-coding and project documents to the OpenSpending visualisation – some of this is already available in the original source data, but has not yet been incorporated to this dataset;
- Other visualisations – for example, a map, and activity and transaction views;
- Running the dataset compilation automatically – so that it runs on a server nightly, is up-to-date and imports the latest version to OpenSpending as it’s updated.
The future
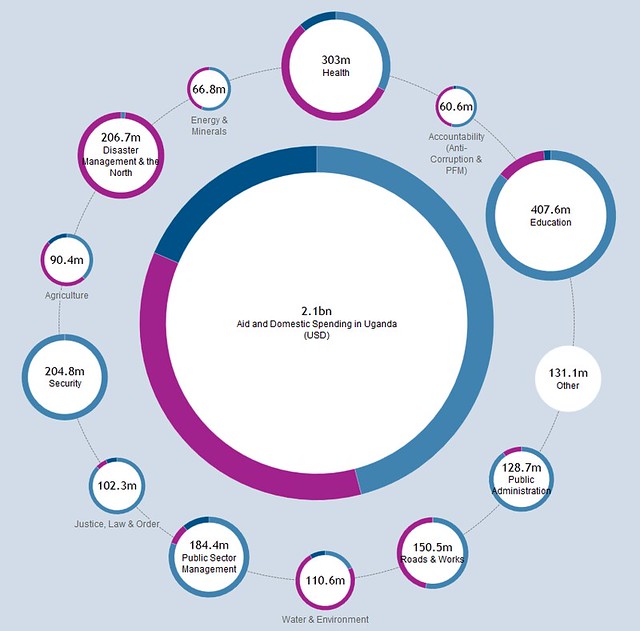
Eventually what we’d like to see is something like this: an integrated dataset of aid and budgets in each country, so that the full picture of resource flows is available.

Which country will be next to join up their aid and budgetary flows? You can get in touch with us via the mailing list if you have any questions about this project or the data.
This post was written by Mark Brough. It is cross-posted on the OpenSpending blog.


