I once heard a brilliant government official say that in government you only measure what matters to you. This resonated with me back when I was a public servant and it makes even more sense now that I have participated over the last few years in the Global Open Data Index (GODI), one of Open Knowledge International (OKI)’s main projects.
We developed GODI to address the question how much government information is published as open data. The index uses a league table that ranks countries from most to least open, based on their results for fifteen key datasets. In addition the survey compares the openness of key datasets worldwide, and lists which countries have, for example, the most open budgets, company registers or election data.
But national open government data is only one aspect of the open data ecosystem. The Open Data Survey, the tool that powers GODI, allows to collect information on any aspect of open data. Many organisations have repurposed the survey throughout the years to foreground information that these organisations find important, urgent or that help them reach their goals. In this blogpost I will highlight a few use cases of the Open Data Survey. In a follow-up post I will explain how you can start using the survey to measure what is important for you, whether with OKI hosting an instance for you or by deploying your own survey.
The Open Data Census
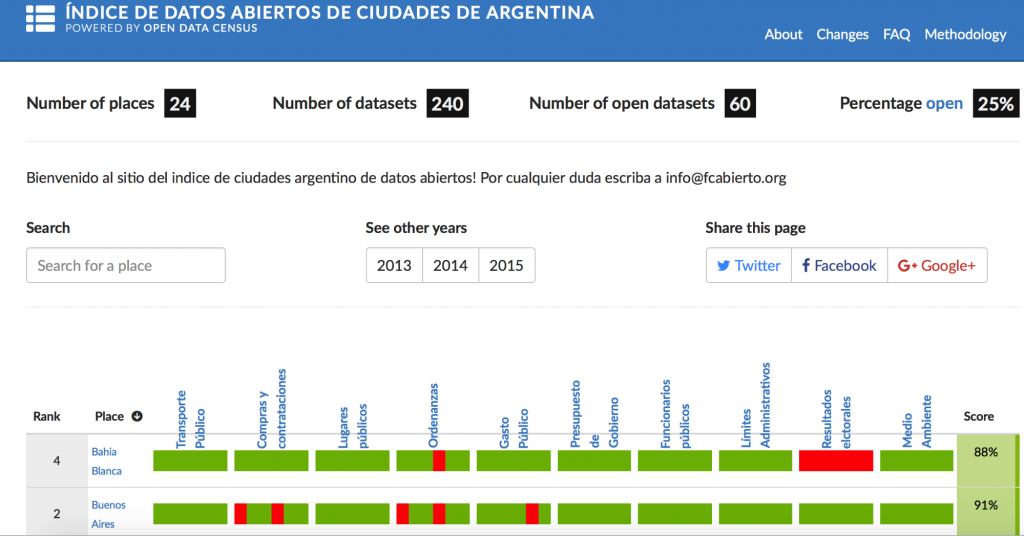
Our first example is the Open Data Census, a tool usually run by our local groups and chapters to understand how their local governments are performing in data publication. We have a record of about 40 different censuses assessing local and regional open data in many different countries. The census is the only tool to assess open data on a city level.

Users of the Open Data Census include Open Knowledge Argentina, Open Knowledge Brazil and the Sunlight Foundation who assessed the openness of U.S. cities as part of its Open Cities programme. The Census results did not only highlight top performing cities in the United States, but also enabled Sunlight Foundation to do further policy analysis and understand why some cities perform better than others.
Similar to the Global Open Data Index, the census measures the openness of around fifteen different datasets. But it is also fully customisable, allowing any organisation to assess various aspects of open data – from open data policies, through to publication of good quality data, or whether a local government engages with citizens to identify and publish the most relevant data.
Code for America’s digital services survey
Code for America repurposed our Open Data Survey to assess the state of digital services in U.S. cities. As part of their Digital Front Door initiative, Code for America used a fork of the survey to assess if the government websites were “meeting Code for America’s criteria for good digital services, and prioritize opportunities for improvements”. With more than 40 cities assessed, this was probably one of the biggest alternative uses for the survey and a great example how to assess aspects such as design of websites (which is an important element for open data publication).
Assessing WASH resilience
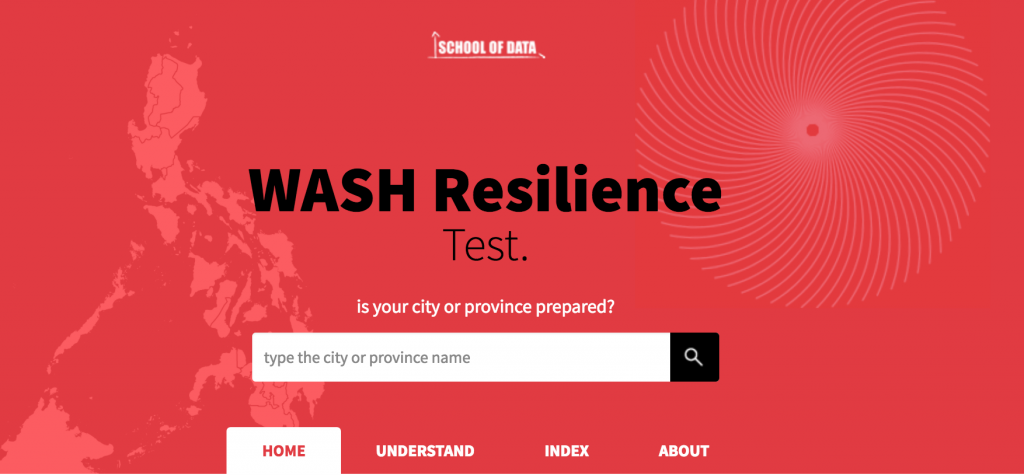
Sheena Carmel Opulencia-Calub, a 2015 School of Data fellow, used the survey to produce a public local information resource centred around Water, Sanitation and Hygiene (WASH) needs, to guide policy-making in the Philippines and advance disaster risk preparedness of local authorities. The website is currently a proof-of-concept, designed for information managers from government and CSOs who take care of data gathering and sharing during emergency situations. The website also visualises the evolution of key indicators related to water and sanitation, helping local authorities and information managers to make better-informed decisions.

It uses two types of league tables, including a ranking of WASH data quality and availability of the 225 cities and provinces of the Philippines. The contents are now outdated but this example shows how the Open Data Survey can be repurposed to not only assess the availability of open data in a specific sector, but also to link this assessment to follow-up actions with government.
Measure what matters to you
To conclude, the Open Data Survey is a versatile tool and can be used to rank, compare, and highlight very different aspects of (open) data. I hope abovementioned use cases sparked your interest and ideas how to use the Open Data Survey. Stay tuned – in a follow-up blogpost we will explain how to customise the survey in order to make it fit your needs.
Oscar Montiel is the international community coordinator at Open Knowledge Foundation


