Co-authored by Lizzie Ellis (Code for DC, USA) and Anna Ścisłowska (Association 61, Poland)
This blog is part of the event report series on International Open Data Day 2018. On Saturday 3 March, groups from around the world organised over 400 events to celebrate, promote and spread the use of open data. 45 events received additional support through the Open Knowledge International mini-grants scheme, funded by Hivos, SPARC, Mapbox, the Hewlett Foundation and the UK Foreign & Commonwealth Office. The events in this blog were supported through the mini-grants scheme under the Open Mapping theme.
One of the interesting things about a global event like Open Data Day is that everyone has their own take on what “Open Data” is and how to talk about it. Our two organizations — Code for DC in the United States and Association 61 in Poland — took totally different approaches to the day, both achieving great results.
Association 61 in Poland ran a webinar with local activists who were not familiar with many IT tools. After long discussions internally and with their trainer, the team chose a few tools, which are easiest for new users to learn: Statistics Poland (governmental geoportal), Google Maps, Scribblemaps and ArcGIS Online (free part of the more professional soft). Participants received the access to videos and manuals, showing step-by-step guides on how to create the presented maps.
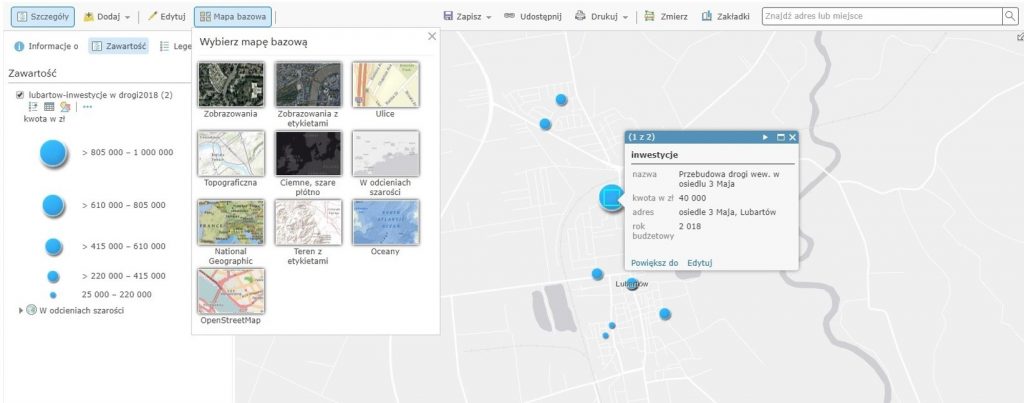
Association 61 invited a local activist from Ełk (a medium size city) to present their idea of the summary of the term of their local gov – they invite people for a series of walks when they discuss the problems in the city space. Then, they showed examples of similar projects, where organizers visualize their findings on maps. Finally, the team presented on how to use Google Maps to create map of barriers in urban space. As part of the presentation, Association 61 demonstrated how to use mapping tools to compare different cities and areas. Over the course of the event, they covered how to compare statistics on a map, how to get involved in the gerrymandering process ahead of the 2018 local elections, and how to compare investment spending in different parts of the city.

Code for DC took a different approach, turning one of their regular bi-monthly hack nights into Open Data Night. These hacknights usually feature 4-5 separate projects of varying technical skill that attendees can choose to work on. Some of these projects are one-night-only, while others can continue for months. For Open Data Day, the group made sure that all the projects available to work on were focused on using open data. A member of the team at Mapbox, a mapping platform, gave an interactive workshop on how to use GeoJSON and open data sets to build maps. The tutorial lasted about an hour, and by the end attendees were able to generate heat maps using the tools provided. There were also representatives from the Sunlight Foundation showing people the US City Open Data Census project and a team of attendees working on data visualizations using public data around rodent infestations that had been reported to the DC government using the 311 hotline.
Adding police data to the U.S. City Open Data Census, @CodeforDC with @PoliceFound + @PoliceOpenData pic.twitter.com/QQUjIOl5L3
— Sunlight Open Cities (@SunlightCities) March 6, 2018
While both these events looked different on implementation, they shared a common goal of helping engage people, especially those who were less familiar with tech and open data tools, around Open Data, and open mapping in particular. Getting a chance to hear in detail about different events definitely inspired us to try new things at future events — Code for DC will definitely be looking into webinar-style hosting in the future, and Association 61 has started looking into learning more about GeoJSON!


