Authors: Delia Walker-Jones (OSM-Colorado) and Kanigui Nara (SCODA Côte d’Ivoire)
This blog is part of the event report series on International Open Data Day 2018. On Saturday 3 March, groups from around the world organised over 400 events to celebrate, promote and spread the use of open data. 45 events received additional support through the Open Knowledge International mini-grants scheme, funded by Hivos, SPARC, Mapbox, the Hewlett Foundation and the UK Foreign & Commonwealth Office. The events in this blog were supported through the mini-grants scheme under the Open Mapping theme.
School of Data (SCODA) Côte d’Ivoire
During the Open Data Day in Abidjan (Côte d’Ivoire), we gathered 13 activists working on extractive industries. Firstly we presented the 2015 EITI (Extractive Industries Transparency Initiative) report for Côte d’Ivoire. This report contains mainly the payments of extractives industries to Côte d’Ivoire government.
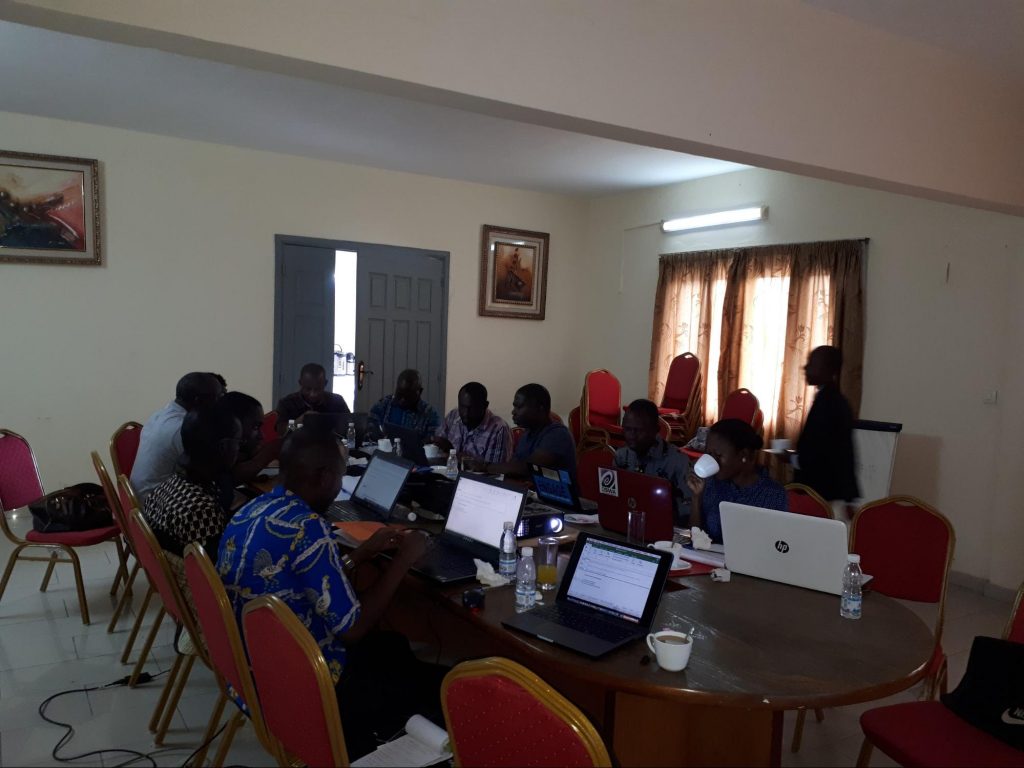
The 2015 EITI report has also published the geographical coordinates of operating licenses in the country. We started by showing to the participants where they can find these data in the report. And the first task was to show how these data were organised and what were their meanings.
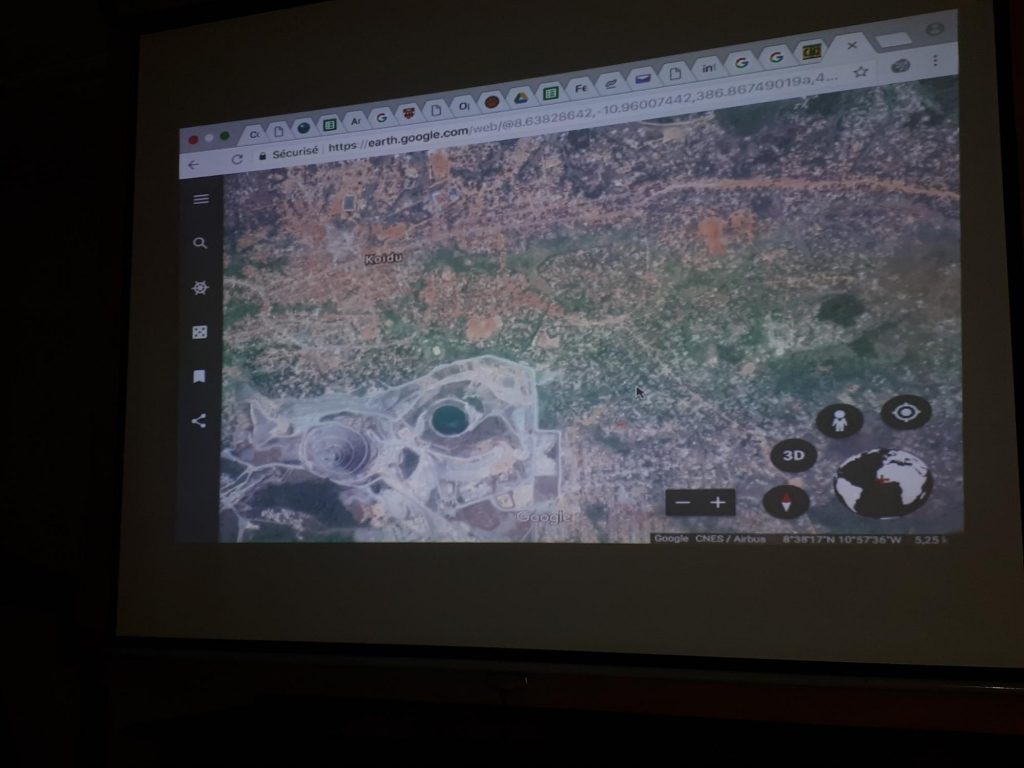
We explained that for each operating license, there were geographical coordinates of delimitation points of the operating field. We also discussed about the definition of longitude and latitude and the encoding system (degree minutes seconds) that has been used in the report. After that, participants were divided into groups of two persons. And, we asked to each of these groups to use Tabula in order to extract the geographical coordinates of the operating license of Societe des Mines d’Ity. This firm is operating in the west part of the country.
One of the important challenges of the day was to clean up the extracted data. We had already prepared a step by step cleaning spreadsheet. We started by introducing the different functions that have been used for cleaning. Functions like “LENGTH”; “FIND & REPLACE” ; “MID” and “SUBSTITUTE” were presented before going through the spreadsheet.
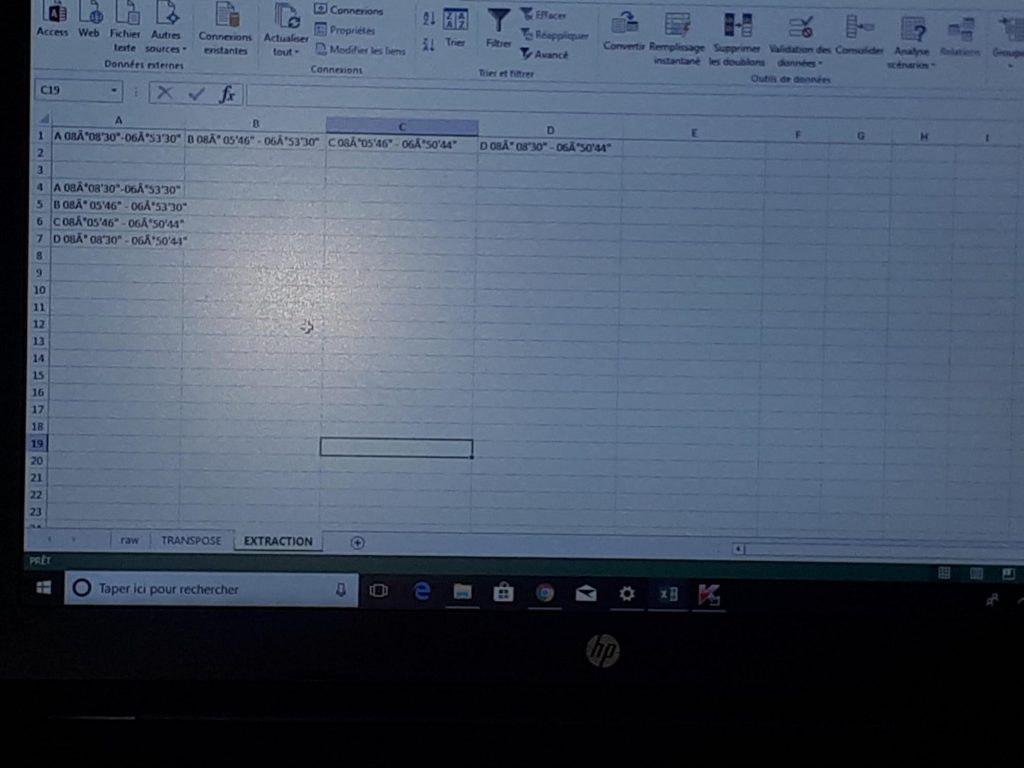
Once data were cleaned up and formatted by name of firm, delimitation points, longitude and latitude; we converted longitude and latitude into Degree Decimal format. Then, we made an introduction to Umap and each group created a map project and started to add the delimating points of the operating license of Societe des Mines d’Ity.
In terms of lessons, this event was an opportunity for participants to understand geographical coordinates and strengthen their skills in terms of data extraction and data cleaning.
We recommend to make sure that participants have a clear understanding of geographical coordinates before starting a mapping event. The next step for us is to design specific training in mapping and to organise mapathon events using OSM.
Open Street Maps (OSM) Colorado: Ger Community Mapping Center mapathon
In Denver, Colorado during Open Data Day, with the assistance of a grant from Mapbox, Open Street Maps Colorado hosted a mapathon for the Ger Community Mapping Center, a non-profit based in Ulaanbaatar, Mongolia. The weather outside was warm and sunny, but the mapathon nonetheless lured a number of GIS and geography professionals and students into a local university conference room for an afternoon spent on Open Street Maps, digitizing aerial imagery from Mongolia.
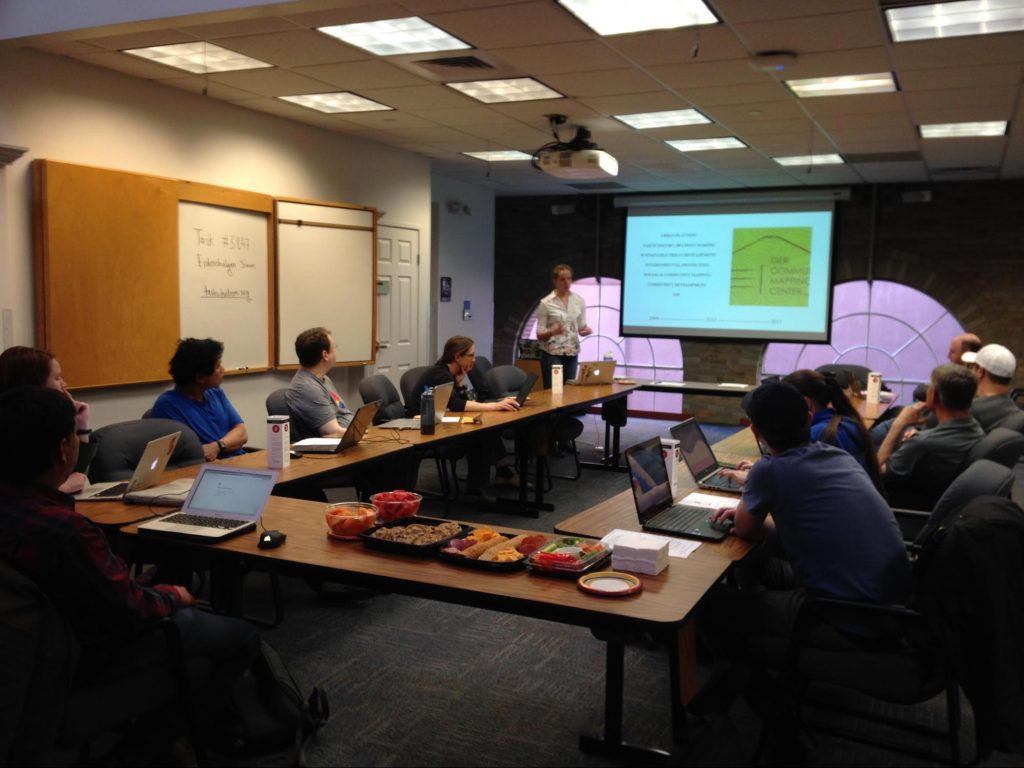
We opened the event with a couple presentations about Open Data Day and about the region of Mongolia the Ger Community Mapping Center elected to map. The Arkhangai province, the selected region, is a mostly rural province about 300 miles west of the capital Ulaanbaatar.
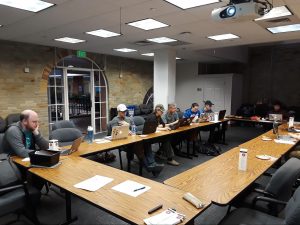
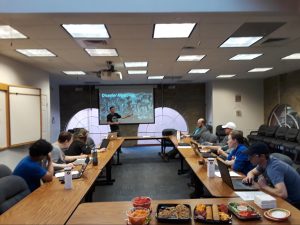
We saw from the aerial imagery in Open Street Maps the incredibly varied geography of the Arkhangai province, from tiny, barely visible track roads and vast forests in some areas to densely populated residential neighborhoods filled with dozens of gers (yurts) in other areas. As the participants slowly digitized the many features, this varied geography sparked conversations about how to classify smaller roads barely visible in the grass, and where to delineate residential areas in a consistent manner.
Conversations moved towards the topic of open data, as well. Questions about how to determine standards for open data, and the ethical ramifications of privacy and open spatial data through aerial imagery came to light. In the case of this mapathon, we discussed gers (yurts) and the importance of including gers in spatial data. While in many Western contexts buildings like gers would not be included, and, in fact, have not warranted a separate OSM tag, gers seemed necessary to incorporate within the cultural context of Mongolia–even inside the capital city of Ulaanbaatar, many Mongolians still live in Gers. Gers, therefore, are not only a feature that belongs on a map of Mongolia, but are also an essential feature to assessing population and the movements of the estimated 30% of Mongolians who are still nomadic or semi-nomadic.
By discussing topics like this, we hoped to bring to light a part of the world not many people living in Denver, Colorado know about, and to provide a substantial amount of new shapefiles and data for the Ger Community Mapping Center to use in future projects.


