
This text shows a real case of how the Open Data Editor (ODE) impacted the workflow of an organisation working to serve the public good.
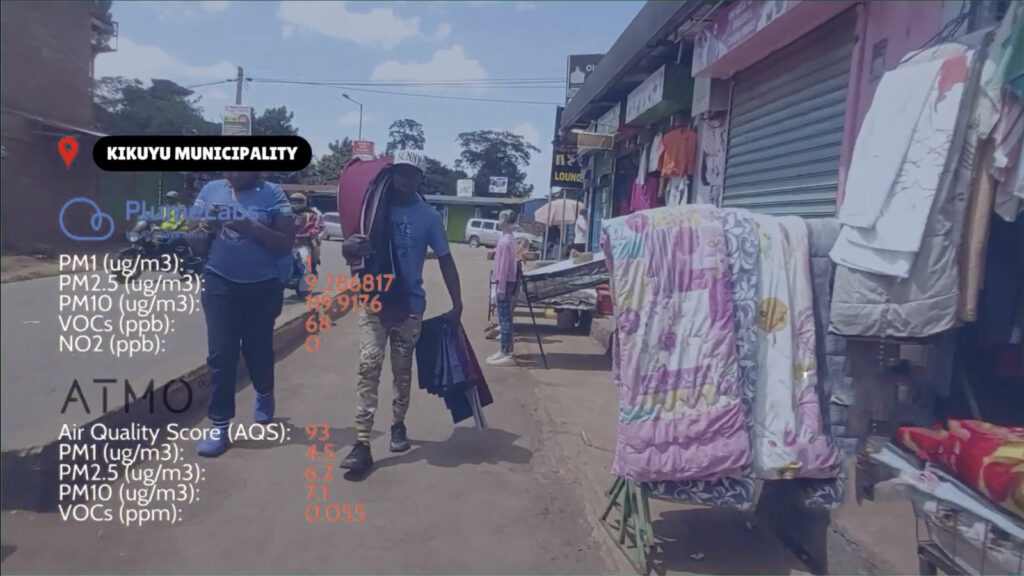
Image taken during the street-by-street urban air quality monitoring activity in the municipality of Kikuyu, Kenya, in 2024. Source: YouTube
Organisation: The Demography Project
Location: Nairobi, Kenya 🇰🇪
Knowledge Area: Environmental Justice
Type of Data: Air Quality
The Demography Project is an independent youth-led non-profit organisation founded in 2022 in Nairobi, Kenya. They leverage affordable & accessible civic technology, citizen science, collective action and grassroots journalism through citizen-generated data and open-government data. The overall goal of their work is to amplify community voices and enhance citizen capacity to participate in advancing accountable governance, participatory democracy, environmental conservation and public awareness.
They do this through different projects, such as Maai Makwa, a water quality and quantity monitoring project; Infrastracker, focused on empowering vulnerable communities with open-source tools and data for climate action; and Bungeni, a parliamentary monitoring project for the County Assemblies of Kenya.
The Challenge
Problem
One of the tasks carried out by The Demography Project team and volunteers is the collection of environmental data to measure the air quality of a given location. This is done in the field, on long walks during which the project team carries various sensors to determine, among other things, the level of pollution, humidity, atmospheric pressure and the presence of various chemical elements such as nitrogen dioxide (NO2), volatile organic compounds (VOCs) and many others.
To make these measurements, they use different devices, manufactured by different companies, with different capabilities – for example, the Plume Labs Flow 2 sensor measures parts per billion (ppb), while the Atmotube Pro measures parts per million (ppm). In addition, none of the sensors provide geolocation data, forcing the project team to collect GPS data separately.
These different databases, from a total of four sources, generate a large number of spreadsheets as measurements are taken every second. It’s only by harmonising this data and making it ‘talk’ to each other that they can draw conclusions about the air quality measured during a given field trip. In other words, they have to compile all the data into one giant spreadsheet that is virtually impossible for the human eye to check.
They also face a lack of specialised human resources. There are currently 16 people involved with The Demography Project , most of them volunteers. Of these, only two have any technical knowledge of database management, and that in a limited capacity.
Impact
Organising and compiling hundreds of rows of a table of raw technical data (mostly numbers) is a near-impossible task for a human, and it used to take months for the team to reach a minimally adequate level for analysis. They would search endlessly for zeros, empty cells and other inconsistencies. As well as the time and effort involved, there was always the feeling that the data wasn’t accurate enough, which could ultimately compromise the quality of the results and make all the hard work go to waste.
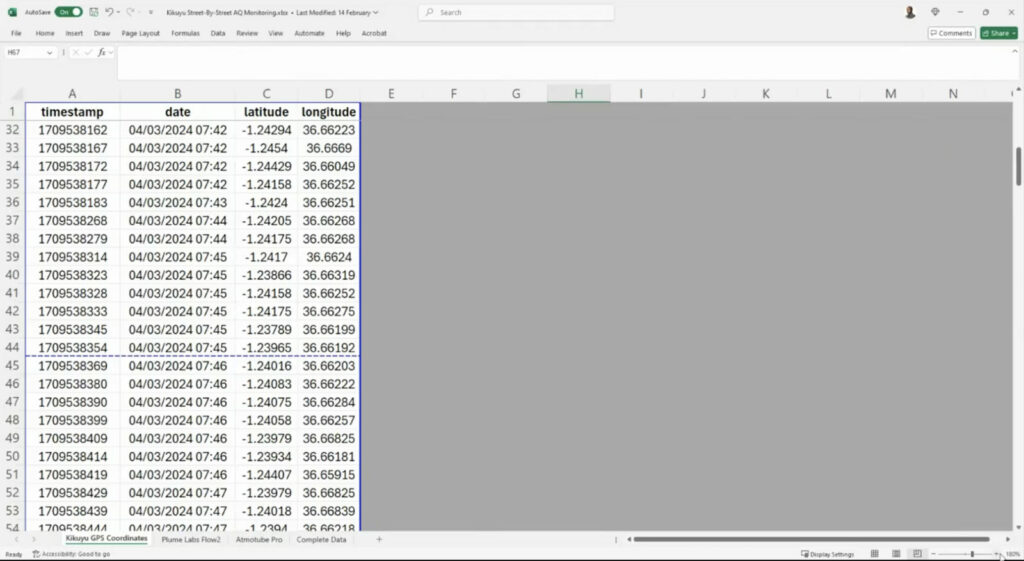
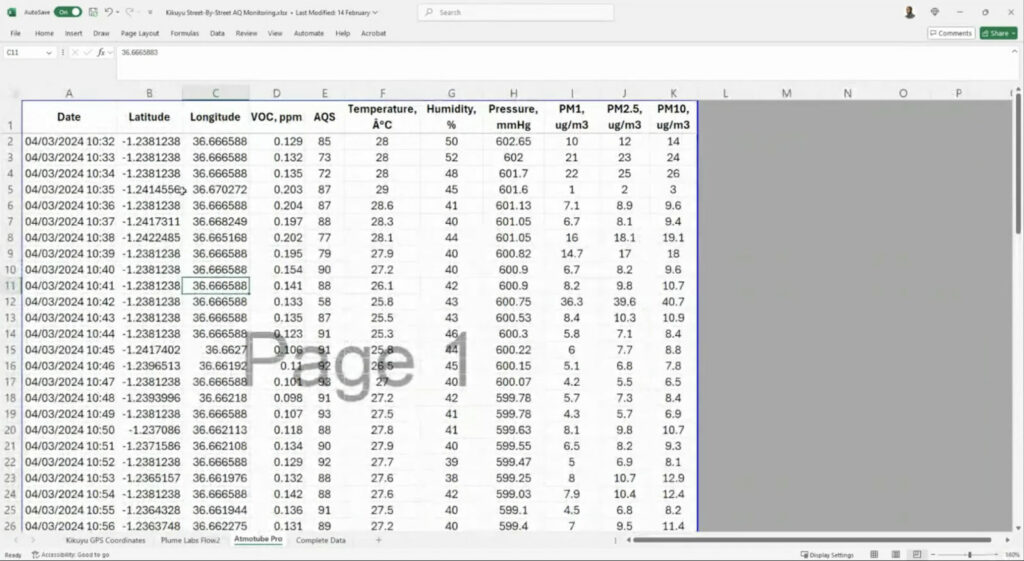
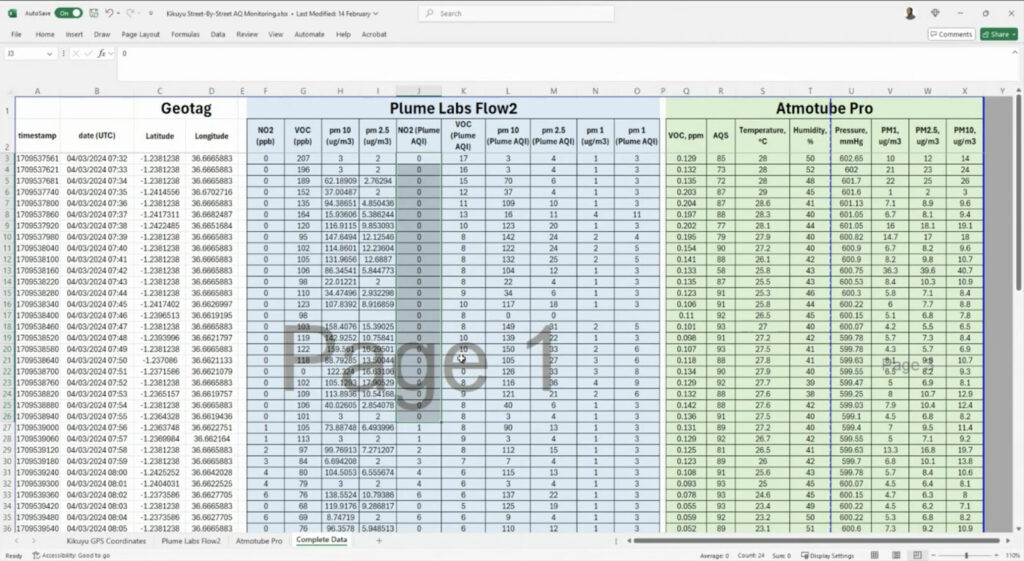
Examples of some of the different datasets the Demography Project team works with.
The Solution
The Demography Project team uses the Open Data Editor (ODE) to look for errors in the gigantic spreadsheets consolidated after data collection in the field. These tables, which compile data from different sources (including two portable air quality monitors, GPS devices, smartphones), have many inconsistencies that are detected in seconds. Once the errors have been identified, they can then correct the missing or incorrect data, increasing the dataset’s quality.
According to the team, ODE is also very useful for understanding how data works in general and the importance of standards.
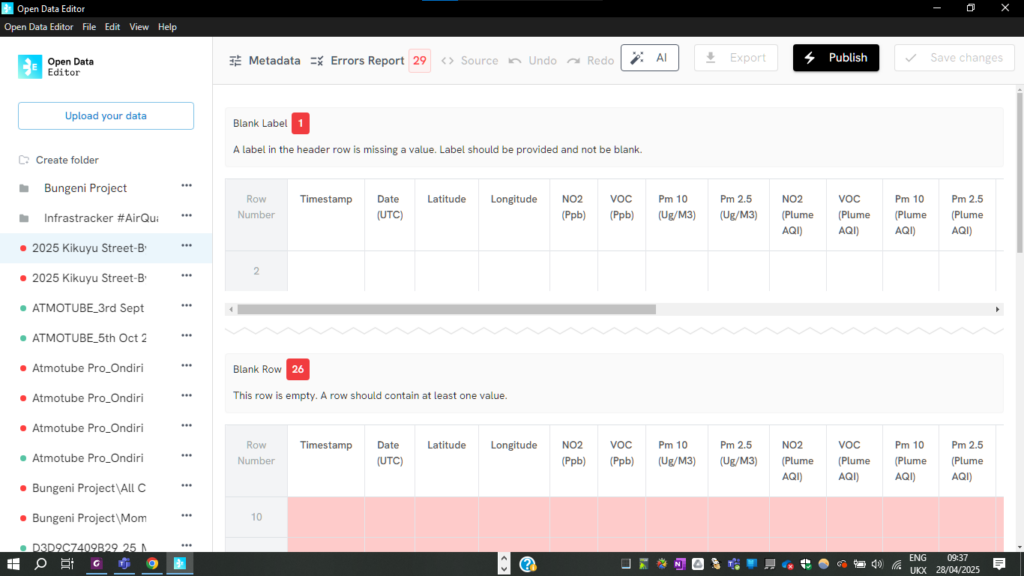
In the spreadsheet, ODE identified 29 inconsistencies and errors in the dataset.
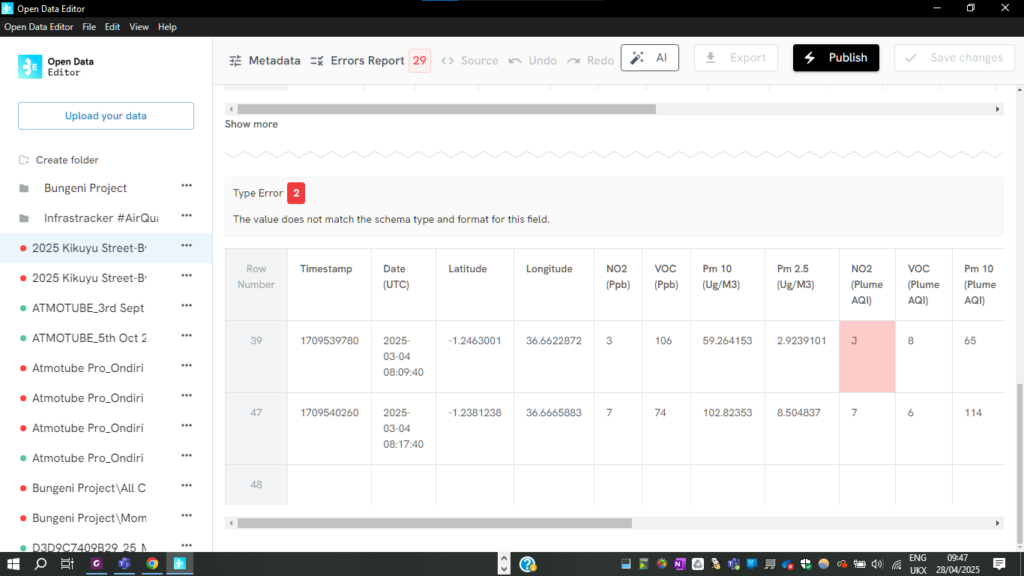
Above: ODE identified alphabetic elements in two cells from raw data extracted from the portable air quality monitors, which should have been in numeric format.
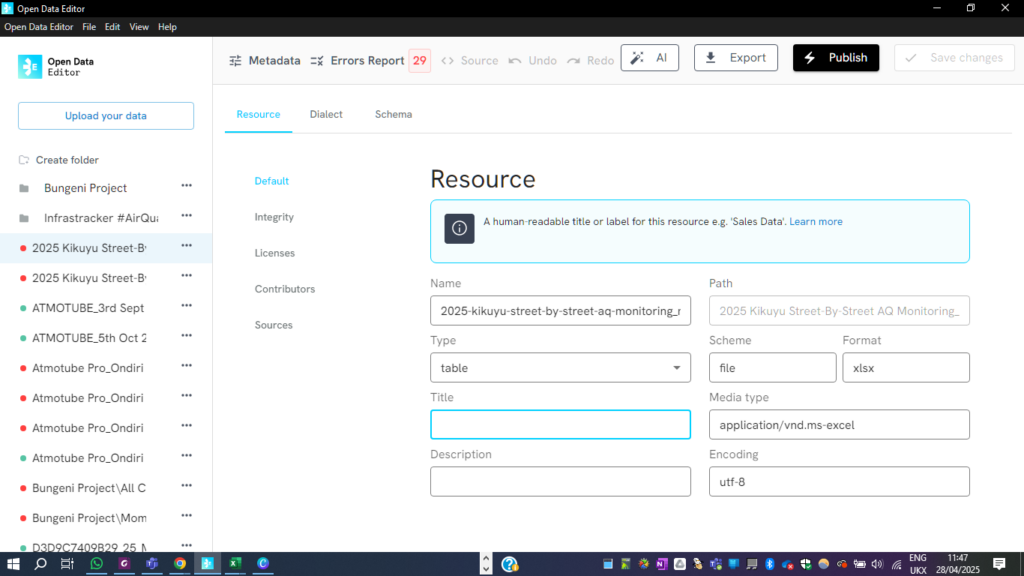
The ODE metadata panel proved to be a key resource for the team to learn more about how data works.
The Results
- Reduced error resolution time from months to seconds
- Ensuring that the data is good enough to be analysed
- Enabled the team to focus on the data collection in the field
- Identification of data gaps, particularly GPS coordinates, which distort data outputs
From the data analysed from the Street-By-Street Air Quality Monitoring Activity in Kikuyu Municipality, the air quality is relatively safe and within the parameters set by Kenya’s Environmental Management and Co-ordination (Air Quality) Regulations, 2024 and the World Health Organization’s Global Air Quality Guidelines 2021, with an average Air Quality Score of 85, compared to 62 in Kenya’s capital city Nairobi.
As the infographics below show, this is the kind of conclusion and output that Open Data Editor has helped The Demography Project to develop faster, increasing its social and environmental impact.
Quote

Richard Muraya, Executive Director
“The reason we’re so interested in the Open Data Editor is that it highlights the gaps we have in terms of data collection. Before ODE, it was a challenge to identify where the zeros were or where we didn’t have accurate readings from our monitoring hardware. With ODE, we have a tool that helps us to identify those gaps and ensure that we have some form of coherence in the tabular data from our air quality monitors, phones and action cameras”.
About the Open Data Editor

The Open Data Editor (ODE) is Open Knowledge’s new open source desktop application for nonprofits, data journalists, activists, and public servants, aiming at helping them detect errors in their datasets. It’s a free, open-source tool designed for people working with tabular data (Excel, Google Sheets, CSV) who don’t know how to code or don’t have the programming skills to automatise the data exploration process.
Simple, lightweight, privacy-friendly, and built for real-world challenges like offline work and low-resource settings, ODE is part of Open Knowledge’s initiative The Tech We Want — our ambitious effort to reimagine how technology is built and used.
And there’s more! ODE comes with a free online course that can help you improve the quality of your datasets, therefore making your life/work easier.
Download Open Data Editor 1.4.0 using the following buttons:
↪️ Take the course: Learn how to use ODE
All of Open Knowledge’s work with the Open Data Editor is made possible thanks to a charitable grant from the Patrick J. McGovern Foundation. Learn more about its funding programmes here.