


This post is by Gregor Aisch, graphic designer and visualisation architect on the OpenSpending project. Today, at the OpenSpending worksop at OKCon2011 he gave a sneak preview of some of the work he has been doing to create new visualisations for OpenSpending, including a re-adaptation of David McCandless’ famous bubble visualisation from ‘Where Does My Money Go?’
We recently re-implemented the bubble visualisation from WDMMG to make it more re-usable for almost every dataset. Our main aim was to use it in the OpenSpending explorer which lets users explore and analyse government spending in a fun way. We now call the visualisation radial bubble tree, or just bubble tree, because that’s what it actually does: displays tree datasets in a radial layout with bubbles representing the individual nodes. For our purposes, each node represents a budget item.

For the new version of the bubble tree, we chose to switch to JavaScript/SVG instead of Flash for some reasons. The major reason was that we wanted to open the visualisation to a broader developer community, since there are more JS coders out there than Flash coders. This decision was also motivated by ongoing developments in the browser technologies which we’re very excited about. Finally, pure JS application easier to deploy and debug.
Instead of just re-creating the exact visualisation that is still live at WDMMG, we decided to go a step back to the initial layouts by David McCandless and look what we might do better this time. There were a couple of points we didn’t like in the first version, for instance the way the bubbles moved in the transitions or the fact that the bubble scale wasn’t consistent inside the views. All these flaws are fixed in the new version.
Another new feature we introduced is horizontal navigation. In the old version as well as in the tree map found at OpenSpending.org the only possible way of navigation through the spending trees is to go down to a child or up to the parent item. For instance, a user who might want to look around through all items in the first level of the tree had to visit the main item very often. Now we have enabled the option to directly jump to the left and right hand items of the selected item.

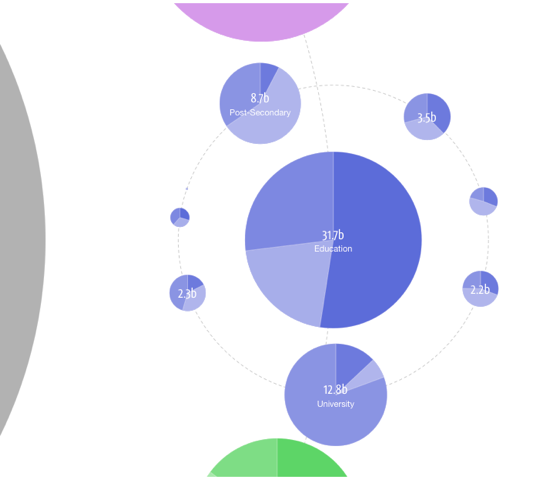
Also we introduced a new bubble type. Our goal was to display another breakdown per bubble. For doing that, we had the idea of using the area of the bubble for displaying another mini-chart. After experimenting with a few ideas we ended up with what we now call the donut bubbles.

Since we also opened up the new visualisation in terms of the application interface it is now very easy to integrate the bubble tree with other visualisations, like we did in the following experiment. Here you can see the bubble tree combined with a regional map of the UK. The map shows the regional breakdown of the last clicked bubble.

The work on visualisations is ongoing and we hope to have them online soon. We are also hoping to give users the option of a dashboard of plug-and-play visualisations replicating much of the ‘Where Does My Money Go?’ functionality in OpenSpending. Expect more updates soon!
There will be more sessions on OpenSpending at OKCon2011. If you want to join us in Berlin – you can join us by registering here. You can also follow @openspending on Twitter for more updates. The hashtag for the conference is #okcon2011.
Nice visuals! But why wasn’t this able to be done simpler with bar graphs. Introducing circles and sphereS is very misleading in graphs because it is hardler to judge the size difference between a group of circles/spheres compared to bars or lines.